X Tutup

Communication Solutions

Turning data into stories that connect 

Become a thought leader in your industry or strengthen your marketing communication with data-driven content formats and targeted distribution.

Collage showing the European Accommodation Barometer 2025 by Booking.com and Statista, including the main report cover, country editions, issue briefs, charts, social media assets, and mobile formats.
Collage of Siemens industrial content, including reports, infographics, and digital assets on manufacturing, engineering, and simulation topics
Collage illustrating the Logistics Trend Map, including report pages, webinar promotion, and logistics insights
1/5

Our Communication Solution Portfolio

  • Data Storytelling
  • Data Visualization
  • Reach Your Audience

Data Storytelling

We combine analytical depth, narrative structure, and impactful visualizations to turn complex data into compelling stories. Leverage Statista's proprietary data or use our full-service market research division to generate exclusive data for unique content.

See examples

Collage illustrating the Logistics Trend Map, including report pages, webinar promotion, and logistics insights

Data Visualization

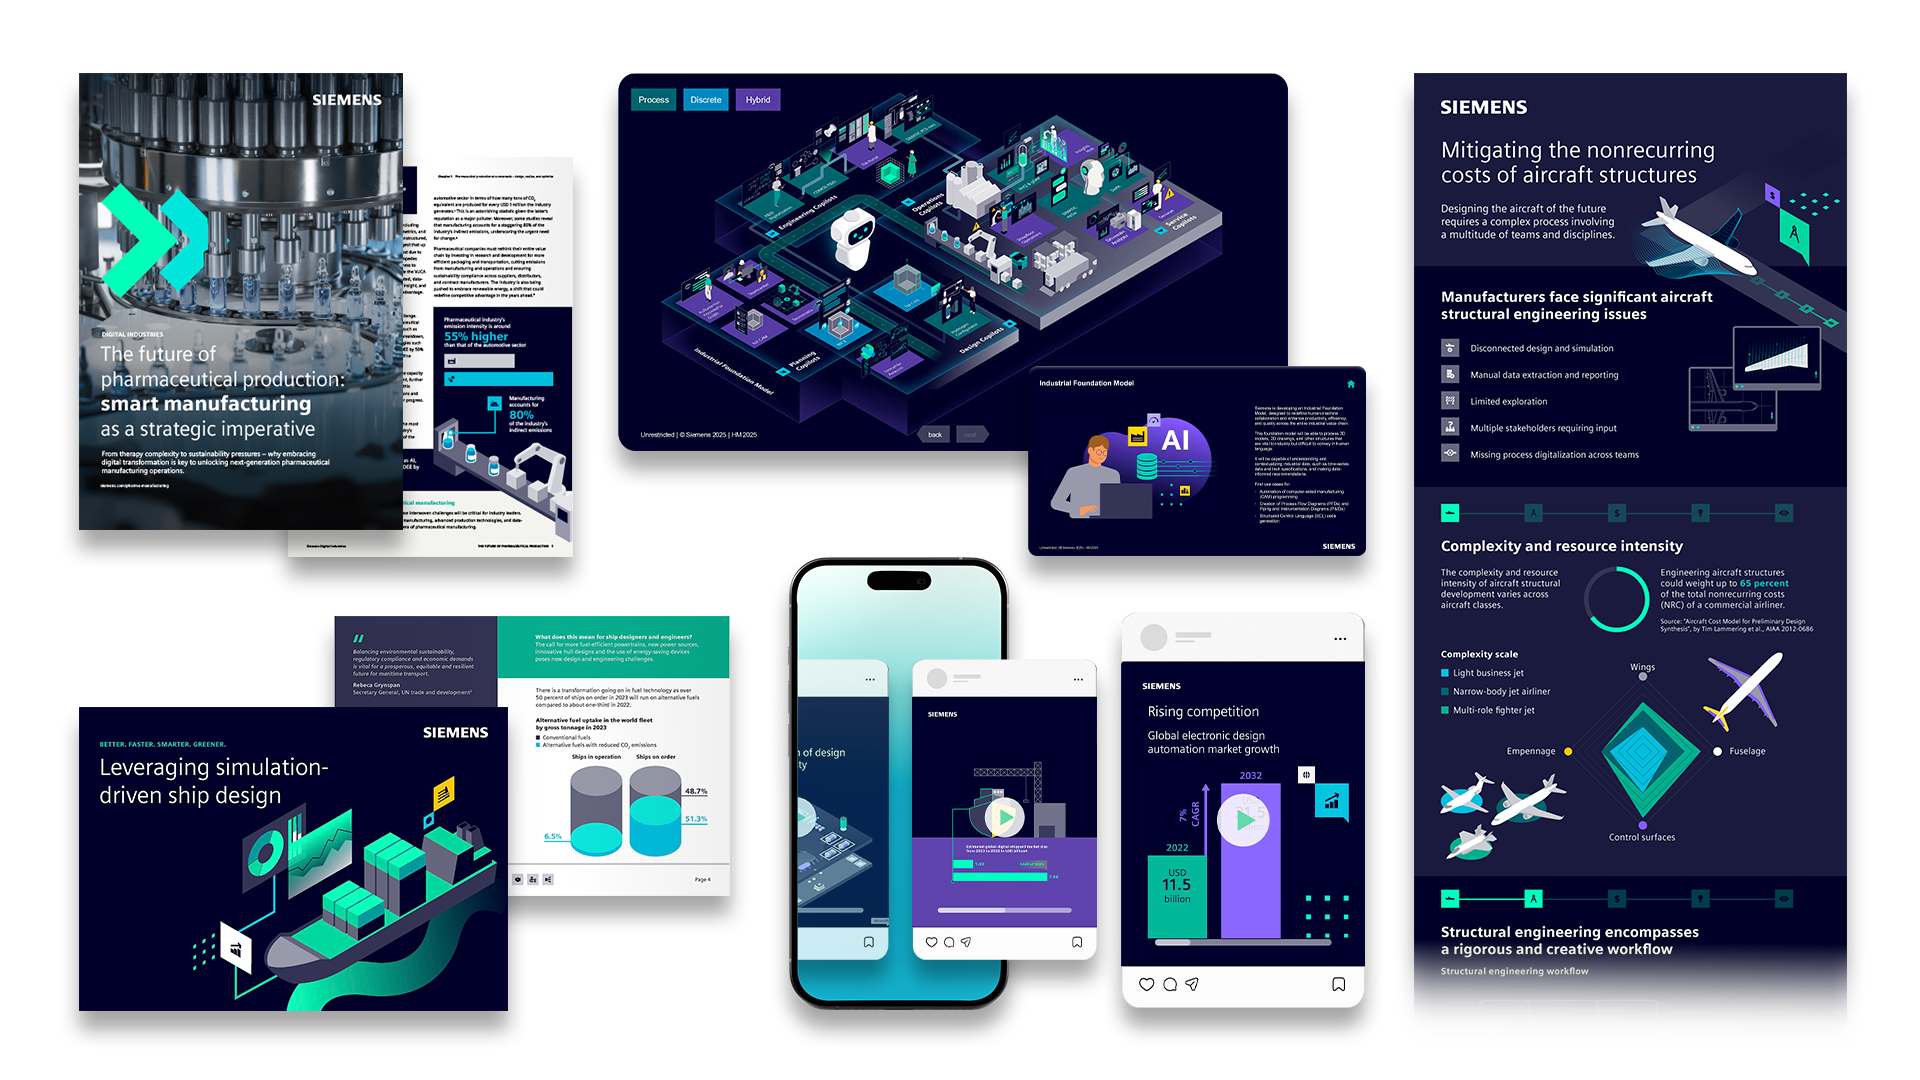
Get creative formats for all touchpoints. From flagship studies, content hubs to whitepapers, reports, infographics, and videos.

See examples

Collage of Siemens industrial content, including reports, infographics, and digital assets on manufacturing, engineering, and simulation topics

Reach your audience with Statista

Leverage the Statista B2B reach to distribute your message through our newsletters, banners on the Statista platform and our partner network.

See examples

Collage of email newsletters and content updates displayed on digital screens

What we deliver

From content strategy projects to social infographics

Solutions to increase awareness & reach in your industry

  • Flagship Studies
  • Content Hub
  • Collage showing the European Accommodation Barometer 2025 across report, mobile, and digital formats

    Booking.com

    The European Accomodation Barometer

  • Collage of digital content and social media formats related to digital transformation and AI in the banking sector

    Atruvia

    Study on digital transformation in banking

  • Collage illustrating the Vision E-Commerce 2030 report, including expert insights and related content

    Etribes

    Etribes on the e-commerce vision for 2030

  • Collage of Siemens industrial content, including reports, infographics, and digital assets on manufacturing, engineering, and simulation topics

    Siemens

    Content Hub for Siemens

  • Collage illustrating the Logistics Trend Map, including report pages, webinar promotion, and logistics insights

    Maersk

    Thought Leadership in Logistics

  • Collage showing the European Accommodation Barometer 2025 across report, mobile, and digital formats

    Booking

    Content Hub for Booking

Tell your data’s story in varied creative formats

  • Infographics & Presentation Design
  • Whitepapers & Reports
  • Video & Motion Design
  • Infographic showing safety metrics in the oil and gas industry, including injury rates and spill reduction trends

    Siemens

    Safety infographics for the oil and gas industry

  • Intelligent Systems Blueprint: Total Market — visual roadmap showing stages, impact tiers, and timelines for intelligent systems technologies, from data connectivity and automation to AI-driven optimization and global deployment.

    WNDRVR

    Intelligent systems blueprint infographic

  • How to create a high-performance hybrid workplace

    Autonomous

    Hybrid workplace presentation design

  • Collage illustrating the “Agentic AI in der Praxis” report, including related content formats and webinar materials

    PTA

    Agentic AI in practice

  • Whitepaper cover titled “Scaling up on circularity in fashion and lifestyle”

    Bleckmann

    Circularity and recommerce in fashion

  • Collage of the Business Travel Report 2025 and related digital content

    VDR

    Business travel trends and insights

  • The Annual Lightning Report 2024

    XWeather

    Interactive digital annual lightning report

  • Abstract illustration of a tablet interface displaying data visualizations and layered digital elements

    Komodo

    MapEnhance explainer video

  • Chart showing projected global electric car adoption per year up to 2040

    Quectel

    Animated explainer on EV infrastructure

Use the Statista B2B reach to distribute your message

  • Newsletters
  • Banner Advertising
  • Partner Network

How can we help you?

Canny Sutanto

Creative Director

Sebastian Schurz

Senior Director Statista+ Communications

Jan Ahrens

Senior Director Global Growth

Send your request & we‘ll be in touch shortly

* Required fields

Statista processes the personal data you provide in this form to handle and respond to your request, including any necessary follow-up communication. Further information on how we handle personal data, including legal bases, retention periods and international data transfers, can be found in our Privacy Policy.

X Tutup