Panel del depurador
Muchas de las herramientas de depuración de Godot, incluido el depurador, se pueden encontrar en el panel de depuración en la parte inferior de la pantalla. Haz clic en Depurador para abrirlo.
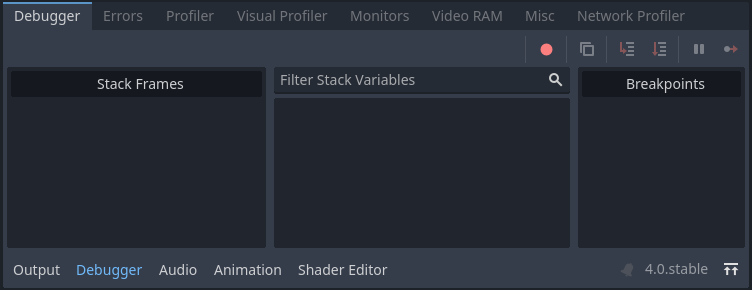
El panel de depuración está dividido en varias pestañas, cada una enfocada en una tarea específica.
Stack Trace
The Stack Trace tab opens automatically when the GDScript compiler reaches a breakpoint in your code.
It gives you a stack trace, information about the state of the object, and buttons to control the program's execution. When the debugger breaks on a breakpoint, a green triangle arrow is visible in the script editor's gutter. This arrow indicates the line of code the debugger broke on.
Truco
You can create a breakpoint by clicking the gutter in the left of the script editor (on the left of the line numbers). When hovering this gutter, you will see a transparent red dot appearing, which turns into an opaque red dot after the breakpoint is placed by clicking. Click the red dot again to remove the breakpoint. Breakpoints created this way persist across editor restarts, even if the script wasn't saved when exiting the editor.
You can also use the breakpoint keyword in GDScript to create a
breakpoint that is stored in the script itself. Unlike breakpoints created by
clicking in the gutter, this keyword-based breakpoint is persistent across
different machines when using version control.
Puedes usar los botones en la esquina superior derecha para:
Saltar todos los puntos de interrupción. De esta manera, puedes guardar los puntos de interrupción para futuras sesiones de depuración.
Copiar el mensaje de error actual.
Entrar en el código. Este botón te lleva a la siguiente línea de código, y si es una función, avanza paso a paso a través de la función línea por línea.
Paso Siguiente en el código. Este botón va a la siguiente línea de código, pero no avanza paso a paso a través de las funciones línea por línea.
Interrumpir. Este botón pausa la ejecución del juego.
Continuar. Este botón reanuda el juego después de un punto de interrupción o pausa.
Nota
Using the debugger and breakpoints on tool scripts
is not currently supported. Breakpoints placed in the script editor or using
the breakpoint keyword are ignored. You can use print statements to
display the contents of variables instead.
Errores
Aquí es donde se imprimen los mensajes de error y advertencia mientras el juego se está ejecutando.
Puedes desactivar advertencias (warnings) específicas en Ajustes del Proyecto > Debug > GDScript.
Evaluator
This tab contains an expression evaluator, also known as a REPL. This is a more powerful complement to the Stack Variables tree available in the Stack Trace tab.
When the project is interrupted in the debugger (due to a breakpoint or script error), you can enter an expression in the text field at the top. If the project is running, the expression field won't be editable, so you will need to set a breakpoint first. Expressions can be persisted across runs by unchecking Clear on Run, although they will be lost when the editor quits.
Expressions are evaluated using Godot's expression language, which allows you to perform arithmetic and call some functions within the expression. Expressions can refer to member variables, or local variables within the same scope as the line the breakpoint is on. You can also enter constant values, which makes it usable as a built-in calculator.
Consider the following script:
var counter = 0

func _process(delta):
    counter += 1
    if counter == 5:
        var text = "Some text"
        breakpoint
    elif counter >= 6:
        var other_text = "Some other text"
        breakpoint
If the debugger breaks on the first line containing breakpoint, the following
expressions return non-null values:
Constant expression:
2 * PI + 5Member variable:
counter,counter ** 2,sqrt(counter)Local variable or function parameter:
delta,text,text.to_upper()
If the debugger breaks on the second line containing breakpoint, the following
expressions return non-null values:
Constant expression:
2 * PI + 5Member variable:
counter,counter ** 2,sqrt(counter)Local variable or function parameter:
delta,other_text,other_text.to_upper()
Perfilador
The profiler is used to see what code is running while your project is in use, and how that effects performance.
Ver también
A detailed explanation of how to use the profiler can be found in the dedicated The Profiler page.
Visual Profiler
The Visual Profiler can be used to monitor what is taking the most time when rendering a frame on the CPU and GPU respectively. This allows tracking sources of potential CPU and GPU bottlenecks caused by rendering.
Advertencia
The Visual Profiler only measures CPU time taken for rendering tasks, such as performing draw calls. The Visual Profiler does not include CPU time taken for other tasks such as scripting and physics. Use the standard Profiler tab to track non-rendering-related CPU tasks.
To use the visual profiler, run the project, switch to the Visual Profiler tab within the Debugger bottom panel, then click Start:
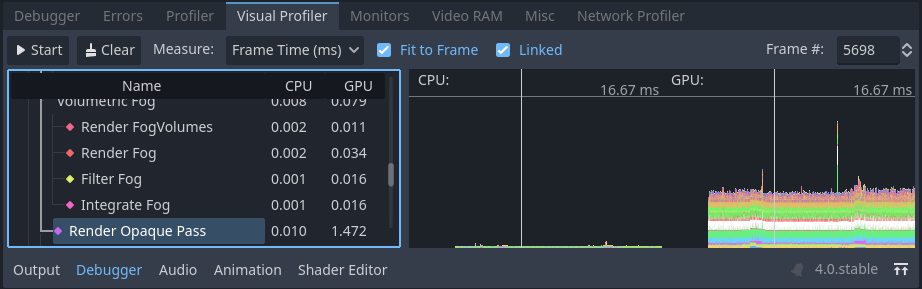
Visual Profiler tab after clicking Start, waiting for a few seconds, then clicking Stop
Truco
You can also check Autostart, which will make the visual profiler automatically start when the project is run the next time. Note that the Autostart checkbox's state is not preserved across editor sessions.
You will see categories and results appearing as the profiler is running. Graph lines also appear, with the left side being a CPU framegraph and the right side being a GPU framegraph.
Click Stop to finish profiling, which will keep the results visible but frozen in place. Results remain visible after stopping the running project, but not after exiting the editor.
Click on result categories on the left to highlight them in the CPU and GPU graphs on the right. You can also click on the graph to move the cursor to a specific frame number and highlight the selected data type in the result categories on the left.
You can switch the result display between a time value (in milliseconds per frame) or a percentage of the target frametime (which is currently hardcoded to 16.67 milliseconds, or 60 FPS).
If framerate spikes occur during profiling, this can cause the graph to be poorly scaled. Disable Fit to Frame so that the graph will zoom onto the 60 FPS+ portion.
Nota
Remember that Visual Profiler results can vary heavily based on
viewport resolution, which is determined by the window size if using the
disabled or canvas_items stretch modes.
When comparing results across different runs, make sure to use the same viewport size for all runs.
El Perfilador Visual es compatible con cualquier método de renderizado (Forward+, Mobile o Compatibility), pero las categorías reportadas varían según el método de renderizado actual y las funciones gráficas habilitadas. Por ejemplo, al usar Forward+, una escena 2D simple con luces que proyectan sombras mostrará las siguientes categorías:
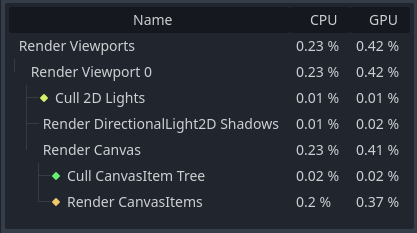
Ejemplo de resultados de una escena 2D en el Perfilador Visual
To give another example with Forward+, a 3D scene with shadow-casting lights and various effects enabled will result in the following categories enabled:
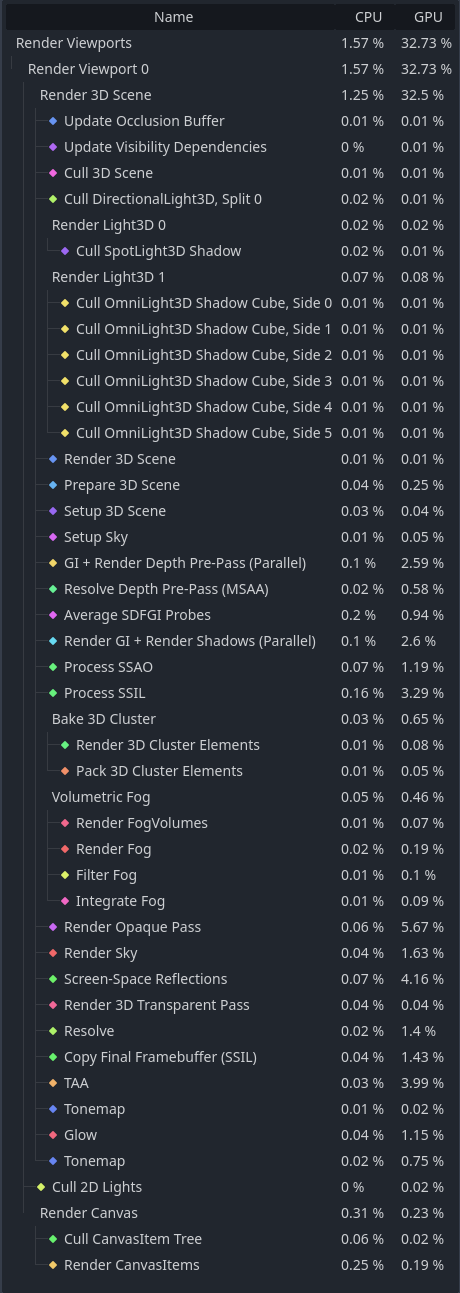
Ejemplo de resultados de una escena 3D en el Perfilador Visual
Notice how in the 3D example, several of the categories have (Parallel) appended to their name. This hints that multiple tasks are being performed in parallel on the GPU. This generally means that disabling only one of the features involved won't improve performance as much as anticipated, as the other task still needs to be performed sequentially.
Nota
The Visual Profiler is not supported when using the Compatibility renderer on macOS, due to platform limitations.
Profiler de Red
El perfilador de red contiene una lista de todos los nodos que se comunican a través de la API multijugador y, para cada uno, algunos contadores sobre la cantidad de interacciones de red entrantes y salientes. También cuenta con un medidor de ancho de banda que muestra el uso total de ancho de banda en cualquier momento dado.
Nota
El medidor de ancho de banda no tiene en cuenta el sistema de compresión propio de la API Multijugador de alto nivel. Esto significa que cambiar el algoritmo de compresión utilizado no modificará las métricas que reporta el medidor de ancho de banda.
Monitores
The monitors are graphs of several aspects of the game while it's running such as FPS, memory usage, how many nodes are in a scene and more. All monitors keep track of stats automatically, so even if one monitor isn't open while the game is running, you can open it later and see how the values changed.
Ver también
In addition to the default performance monitors, you can also create custom performance monitors to track arbitrary values in your project.
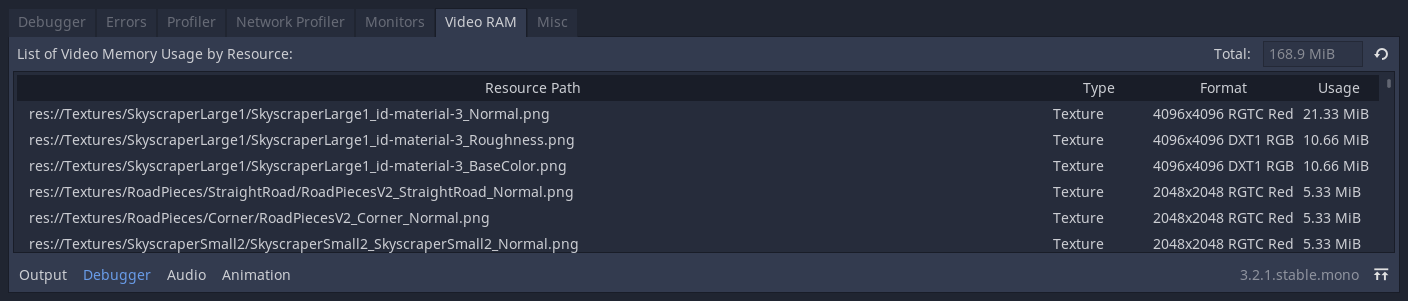
Memoria de Vídeo
La pestaña de Video RAM muestra el uso de la memoria de video (VRAM) del juego mientras se está ejecutando. Proporciona una lista de cada recurso que utiliza VRAM junto con su ruta de recurso, el tipo de recurso que es, el formato en que se encuentra y cuánta VRAM está utilizando ese recurso. También hay un número que muestra el uso total de VRAM en la esquina superior derecha del panel.
Otros
La pestaña de Misc contiene herramientas para identificar los nodos de control en los que haces clic durante la ejecución:
Nodo de Control Clicado te indica dónde se encuentra el nodo en el árbol de escena en el que has hecho clic.
Tipo de Nodo de Control Clicado te indica el tipo del nodo en el que has hecho clic.